
Market & Economic Commentary: Q2 2025
Markets remained resilient in the second quarter of 2025, despite experiencing a sharp dip at the beginning of the quarter. Volatility was sparked by threats of extreme U.S. tariffs combined with tensions in the Middle East. However, markets eventually reacted favorably to both the moderation of the expected duties and economic indicators that remained surprisingly strong. The S&P 500 and Nasdaq Composite both climbed to record highs after dropping near bear territory. International stocks continued to outpace U.S. peers through 2025, with emerging markets rallying amid easing trade fears. Despite the early volatility, the quarter proved to be one of resilience and historic recovery for U.S. stocks. However, investor uncertainty continues to linger.1
Tariffs, Trade Fears, and Market Reaction
Global markets experienced significant volatility following the Trump Administration’s April 2nd announcement of reciprocal tariffs and China’s subsequent retaliation. However, a 90-day reprieve on the most aggressive tariffs initiated a week later prompted a swift market recovery. Also lending optimism to markets, price increases through May plateaued at approximately 2.4%, the average rate the economy has experienced since the end of 2024. In part, this stability may result from companies absorbing some price increases and stockpiling inventories during the first quarter.
Meanwhile, despite layoffs at the Department of Government Efficiency and the downstream funding cuts, employment growth persisted as the healthcare industry and local governments added jobs. As the most pessimistic tariff scenarios failed to materialize, the markets grew more assured that the final outcome would be more moderate than initially feared.
Similarly, yields on the 10-year Treasury rose in early April amid concerns that foreign investments in U.S. Markets would decline and rising national debt would push up long-term borrowing costs. However, by the end of the quarter, yields had dropped below year-end 2024 levels, settling at 4.22%, temporarily easing fears that investors were losing confidence in the U.S. as a safe haven.2
Dollar Weakness Adds Complexity
The U.S. Dollar weakened sharply, with the U.S. Dollar Index falling over 7% in Q2 and nearly 11% year-to-date. This represents its worst first-half performance since the early 1970s. The selloff reflected a mix of tariff-driven slowdown fears, a rising fiscal deficit, and uncertainty over the future independence of the Federal Reserve. A weaker dollar makes international investments more attractive to U.S. investors, but it also renders imports more expensive, potentially contributing to future inflation.3
Emerging Risks Despite Recovery
Despite the moderate impact of economic policy turbulence to date, renewed threats to revisit the higher tariff rates suggested in April, along with some nascent signs of economic slowing, lead to concern that dislocations will soon be reflected in economic data. While job growth has remained positive, gains have been concentrated in only a few sectors. Consumer spending has begun to soften, and rising credit card delinquencies are starting to impact discretionary sectors, such as retail and leisure, which also rely heavily on imports. These sectors have begun moderating future expectations and scaling back hiring, while other industries, including professional services and wholesale trade, have already cut jobs.4
An annual inflation rate of 2.7% released shortly after the end of the quarter hints that prices are beginning to inch higher. While President Trump continues to press the Federal Reserve to lower rates and has escalated criticism of Chairman Jerome Powell, expectations for lower rates are now tempered by possible further price increases, wage growth that has outpaced inflation, and the potential for additional tariffs that would raise prices.
In addition, the recently passed “One Big Beautiful Bill” is projected to significantly contribute to future deficits and is likely to lead to higher long-term interest rates as the government increases its bond issuance.
Tax Changes Under the One Big Beautiful Bill
The passage of the One Big Beautiful Bill (OBBB) essentially extends the tax cuts, tax brackets, and higher standard deductions that were implemented in 2017, offsetting the cost with spending decreases that will primarily impact the Medicaid and Supplemental Nutrition Assistance Program.
The law encompasses a broad set of policy priorities, with the most relevant provisions for individual taxpayers summarized below:
• The standard deduction for 2025 was boosted to $15,750 for single filers and $31,500 for married joint filers. The deductions will rise annually with inflation.
• The estate tax exemption, previously set to sunset in 2026, is now permanent. For 2025, the exemption is $13.99 million per individual with a new base of $15 million per person starting in 2026, and inflation adjustments thereafter.
• The child credit is now permanent, increasing from $2,000 to $2,200 per child. It also will be indexed for inflation going forward.
• The Schedule A deduction for state and local property, income or sales taxes (SALT) rises from $10,000 per return to $40,000. However, this only applies to taxpayers with income up to $500,000 and phases down to $10,000 for income of $600,000 and above. The provision takes effect for tax year 2025 and expires at the end of 2029.
• The 20% qualified business income deduction for pass-through entities as well as the $750,000 cap on mortgage interest deduction, with no adjustment for inflation remains unchanged.
• For charitable donations, starting next year, donors will be allowed to deduct $1,000 (single filers) and $2,000 (joint filers) if they don’t itemize on Schedule A. However, a new limit exists for those who typically itemize charitable donations. This disallows a portion of the deduction equal to 0.5% of a filer’s modified adjusted gross income. This may make the standard deduction more appealing for many.
• Taxes on Social Security benefits were not eliminated. Instead, a new $6,000 per person deduction was added for individuals over the age of 65 with incomes up to $75,000 (single filers) or $150,000 (joint filers) before phasing out. This is in addition to the regular standard deduction and the additional standard deduction for seniors already in the law. The deduction phases out completely at $250,000 joint income. The New York Times recently points out: Under current (i.e. Pre-July 4,2025) law, an estimated 64 percent of beneficiaries did not owe taxes on their Social Security benefit, and the new deduction would boost that number to 88 percent, according to an analysis in June from the White House Council of Economic Advisers.5
• A new $10,000 deduction applies for loans to purchase passenger cars through 2028, but this phases out above income levels of $100,000 and $200,000 for single and joint filers, respectively.
• Clean energy credits will expire on September 30th for automobiles and December 31st for energy-efficient home improvements.
• Starting in 2026, tax-free withdrawals from 529 education-savings plans will be expanded to include more K-12 expenses, as well as expenses for professional certifications and licenses.
Finally, the new law introduces “Trump Accounts,” a tax-advantaged savings account designed to help build wealth for children. Originally called MAGA accounts, these are automatically opened for newborns between January 1st, 2025, and December 31st, 2028, with an initial $1,000 federal contribution. The earnings in these accounts will grow tax-free, similar to IRA accounts and 529s.6
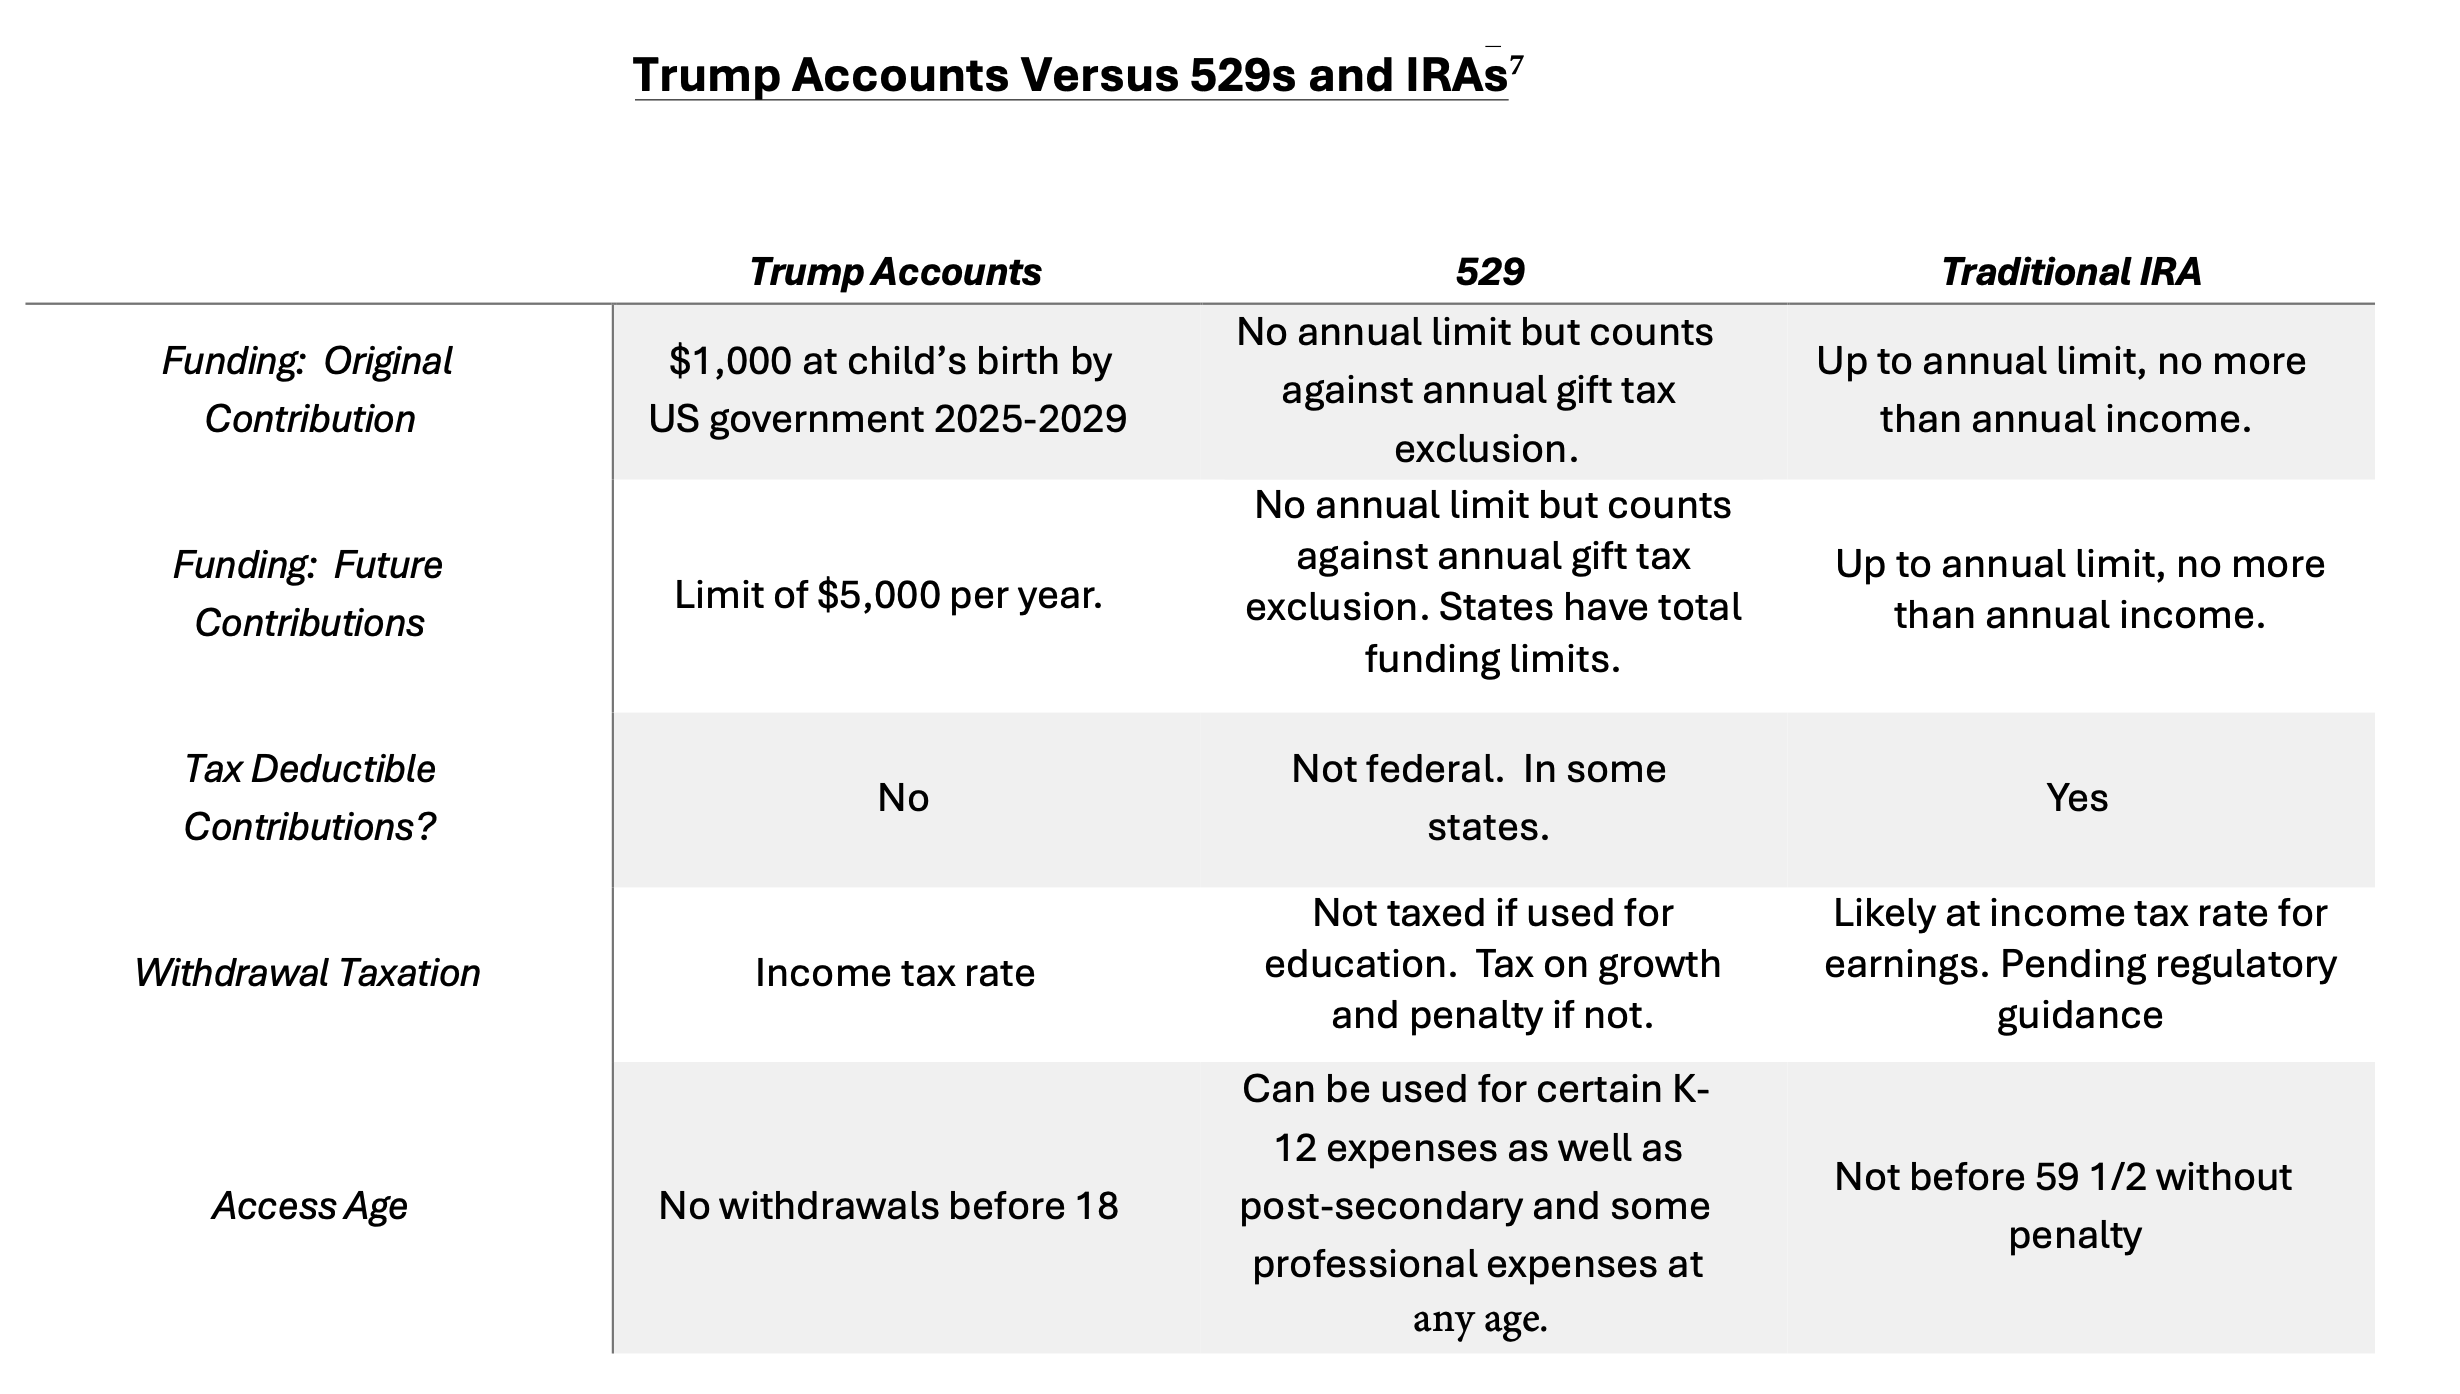
Parents can also open accounts for older children, provided the child is under the age of 18 and a U.S. citizen. The accounts allow for annual contributions of up to $5,000, indexed for inflation, of which employers may contribute up to $2,500 to accounts belonging to an employee or their dependent. Employer contributions would not count toward an employee’s gross income for tax purposes. No contributions can be made to accounts once the beneficiary turns 18.
The accounts may invest in mutual funds and exchange-traded funds that track an index that is composed primarily of U.S. stocks, and annual fees and expenses are capped at no more than 0.1% of the balance of the investment in the fund.
The bottom line is that despite the size of the law and the army of special interests that drove it to completion, the actual changes in store for our clients are expected to be minimal, as its predominant impact was to extend the already enacted tax codes.
US Real GDP Growth vs. US Stock Market Returns: 10-Year Rolling Correlations, Since 1958
During times of policy uncertainty or volatility, a globally diversified investment approach remains the most prudent strategy to ensure investors can capture the growth of current robust economic leaders, potential future emerging industries, and markets with the best relative growth outlooks, while helping mitigate the risk of over-exposure to any one sector or region.
In Uncertain Times, Diversification Remains the Best Approach
While the long-term effects of the OBBB and Tariff policy are still unfolding, growing federal deficits and slowing consumer demand may pose headwinds. Nevertheless, it is important to recall that during times of economic turbulence or uncertainty, individual companies and the broader economy have consistently demonstrated remarkable resilience.
At times of economic inflection points, new industries and economic leaders emerge, while older businesses reorient and adapt their legacy operations to accommodate the new realities. The markets often reflect this budding potential long before it is evident in the general economy.
US Real GDP Growth vs. US Stock Market Returns: 10-Year Rolling Correlations, Since 19588

During times of policy uncertainty or volatility, a globally diversified investment approach remains the most prudent strategy to ensure investors can capture the growth of current robust economic leaders, potential future emerging industries, and markets with the best relative growth outlooks, while helping mitigate the risk of over-exposure to any one sector or region.
Index Disclosure and Definitions
All indexes have certain limitations. Investors cannot invest directly in an index. Indexes have no fees. Historical performance results for investment indexes generally do not reflect the deduction of transaction and/or custodial charges or the deduction of an investment management fee, the incurrence of which would have the effect of decreasing historical performance. Actual performance for client accounts may differ materially from the index portfolios.
S&P 500 Index represents the 500 leading U.S. companies, approximately 80% of the total U.S. market capitalization. Dow Jones Industrial Average (DJIA) is a price-weighted average of 30 significant stocks traded on the New York Stock Exchange (NYSE) and the NASDAQ. The Nasdaq Composite Index (NASDAQ) measures all NASDAQ domestic and international based common-type stocks listed on The Nasdaq Stock Market and includes over 2,500 companies. MSCI World Ex USA GR USD Index captures large and mid-cap representation across 22 of 23 developed markets countries, excluding the U.S. The index covers approximately 85% of the free float-adjusted market capitalization in each country. MSCI Emerging Markets Index is a free float-adjusted market capitalization index that is designed to measure equity market performance in the global emerging markets (as defined by MSCI). The index consists of the 25 emerging market country indexes. Bloomberg U.S. Aggregate Bond Index measures the performance of the U.S. investment grade bond market. The index invests in a wide spectrum of public, investment-grade, taxable, fixed-income securities in the United States—including government, corporate, and international dollar-denominated bonds, as well as mortgage-backed and asset-backed securities, all with maturities of more than 1 year. Bloomberg Global Aggregate (USD Hedged) Index is a flagship measure of global investment grade debt from twenty-four local currency markets. This multi-currency benchmark includes treasury, government-related, corporate and securitized fixed-rate bonds from both developed and emerging market issuers. Index is USD hedged.
The Kaminsky-Silverman Group utilizes Symmetry Partners, LLC (SP), which is a third-party service provider that supplies market data and assists in creation and monitoring of factor-based investment models. SP is also an investment advisory firm registered with the Securities and Exchange Commission. All data is from sources believed to be reliable but cannot be guaranteed or warranted. Different types of investments involve varying degrees of risk, and there can be no assurance that the future performance of any specific investment, investment strategy, product or any non-investment related content made reference to directly or indirectly in this commentary will be profitable, equal any corresponding indicated historical performance level(s), be suitable for your portfolio or individual situation, or prove successful.
Due to various factors, including changing market conditions and/or applicable laws, the content may not be reflective of current opinions or positions. Please note the material is provided for educational and background use only. Moreover, you should not assume that any discussion or information contained in this material serves as the receipt of, or as a substitute for, personalized investment advice.
This material is confidential and is provided for informational purposes only and is not intended to be relied upon as a forecast, research or investment advice, and is not a recommendation, offer or solicitation to buy or sell any securities or to adopt any investment strategy. Investment return and principal value of an investment will fluctuate; therefore, you may have a gain or loss when you sell your investment. Any opinions, expectations and projections within this document are solely those of the Portfolio Manager(s) identified, and do not necessarily represent the viewpoint of Shufro, Rose & Co., LLC or other Portfolio Managers at the firm. This report was prepared by Shufro, Rose & Co., LLC and is presumed to be correct. Shufro, Rose & Co., LLC is an investment adviser registered with the Securities and Exchange Commission. ADV Part 2A is available upon request or at https://adviserinfo.sec.gov/. Please contact Shufro, Rose & Co., LLC at (212) 754-5100 with any questions.
Diversification seeks to improve performance by spreading your investment dollars into various asset classes to add balance to your portfolio. Using this methodology, however, does not guarantee a profit or protection from loss in a declining market. Past performance does not guarantee future results.
https://www.washingtonpost.com/business/2025/06/30/stock-market-record-2q/
https://www.wsj.com/finance/stocks/global-stocks-markets-dow-news-06-30-2025-52905785?mod=hp_lead_pos5
https://www.nytimes.com/2025/06/30/business/dollar-decline-trump.html
https://www.wsj.com/economy/jobs/american-companies-hit-the-brakes-on-hiring-a76cff6f?mod=hp_lead_pos5
https://www.nytimes.com/2025/07/06/your-money/social-security-tax.html#:~:text=Instead%2C%20older%20single%20filers%20will,%24150%2C000%20for%20married%20joint%20filers
https://www.wsj.com/personal-finance/taxes/trump-tax-bill-personal-taxes-319dbceb?mod=hp_lead_pos9
https://www.barrons.com/advisor/articles/trump-accounts-get-ira-makeover-in-senate-bill-heres-what-to-know-3c64e6d6?mod=hp_LEDE_C_1_B_3; https://www.kiplinger.com/personal-finance/family-savings/should-you-start-a-trump-account-for-your-child
https://blogs.cfainstitute.org/investor/2023/03/17/myth-busting-the-economy-drives-the-stock-market/